
The AIM Dashboard displays invoice data captured from the invoices you process in AIM.
The tiles and charts show you statistics about your suppliers and users.
Note: the AIM dashboard is only visible for AIM Admin and AP users.
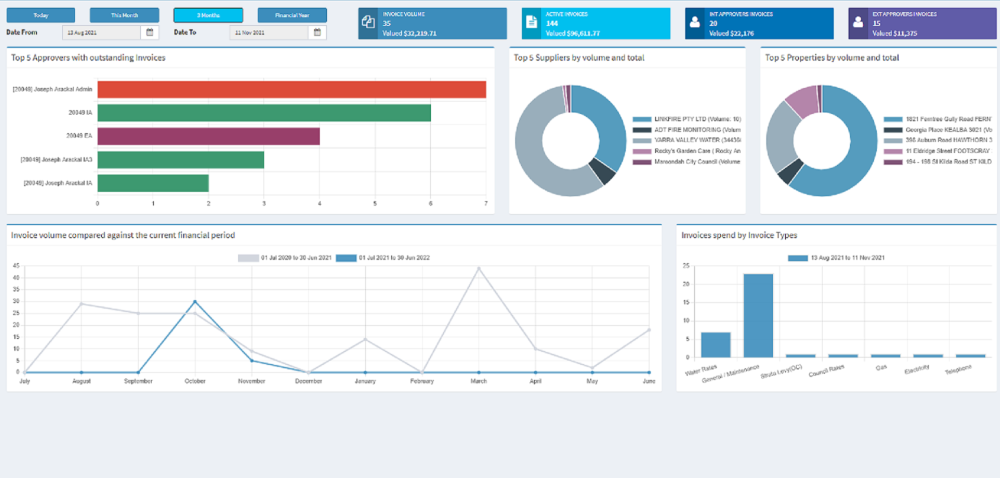
The date range tiles filter the dashboard based on the date range you select.. You can select the preset tiles or select a date range using the date picker

The following tiles and charts show once you’ve made your date range selection.
- Invoice volume
- Top 5 Suppliers by volume and total
- Top 5 Properties by volume and total
- Invoices spend by invoice types
Tiles give you a snapshot view of invoices at various stages in AIM.

-
- Invoice volume – The number of invoices processed for the selected date scope.
- Active invoices – The number of invoices currently active in the System (includes Invoices with all approver types.
- INT approvers invoices – The number of invoices currently sitting with internal approvers.
- EXT approvers Invoices – The number of invoices currently sitting with external approvers.
Dashboard charts
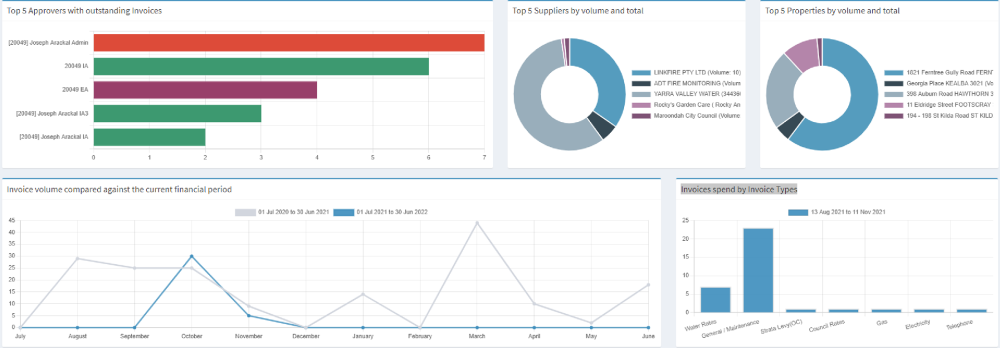
Charts show filtered invoice data in a visual format
-
-
- Top 5 Approvers with outstanding Invoices. A bar chart displays the top 5 Approvers with the most number of nvoices awaiting their approval.
- Top 5 Suppliers. A donut chart displays your top 5 suppliers based on volume and value for the selected date range.
- Top 5 Properties. A donut chart displays the top 5 Properties based on volume and value for the selected date range.
- Invoice volume compared against the current financial period. A line chart comparing the current fiscal year invoice data against the last fiscal year on a month-to-month basis.
- Invoices spend by invoice types. The split of invoices by invoice types for the selected date scope
-
Comments
0 comments
Article is closed for comments.